How it works
Your next dollar can be taxed far more than your bracket says
Most of us picture one tax rate: our bracket. Keep scrolling to see what Social Security does to it.
Example: a married couple with $31,810 of Social Security a year.
A free guide for retirees and their families
Adding Social Security to your income can significantly raise your marginal tax rate in certain income ranges.
Free · Private: nothing you type leaves your browser
How it works
Most of us picture one tax rate: our bracket. Keep scrolling to see what Social Security does to it.
Example: a married couple with $31,810 of Social Security a year.
Zone 1 · The No-Tax Zone
Your income is low enough that, after your deductions, your federal income tax is $0. This is a sweet spot: you keep every dollar.
Zone 2 · The High-Tax Zone
Each extra $1,000 from a pension or IRA also pulls up to $850 of your Social Security into taxable income. Your next dollar is taxed at 22.2%, not the 12% your bracket suggests.
Zone 3 · The Same-Old Zone
Once 85% of your benefits are taxable, no more can be added. Your rate falls back to your bracket and stays there.
See your own graph2026 federal and state tax rates
Our story
A story about a kitchen table, two generations, and what we figured out together.
A note from us
Thanks for reading. If you’ve found your way here, it probably means you heard about The Guetschow Graph and want to know who built it and why. So we thought we’d introduce ourselves.
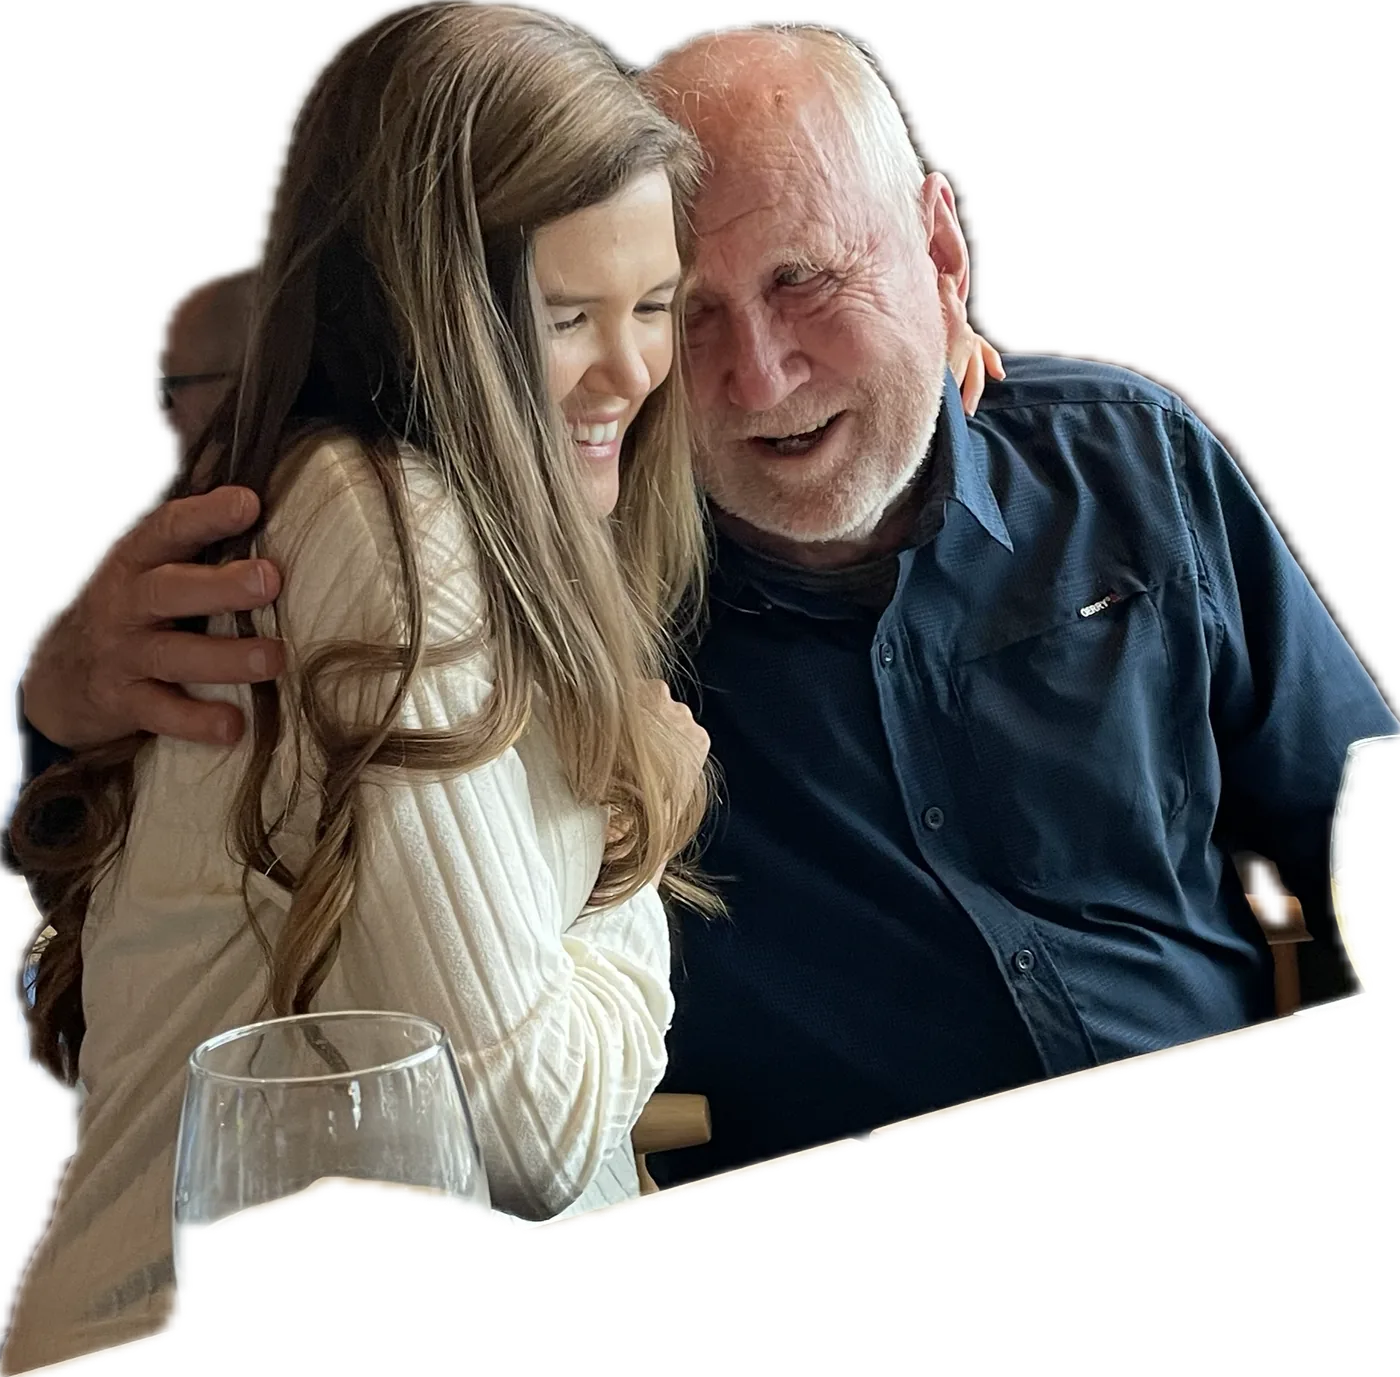
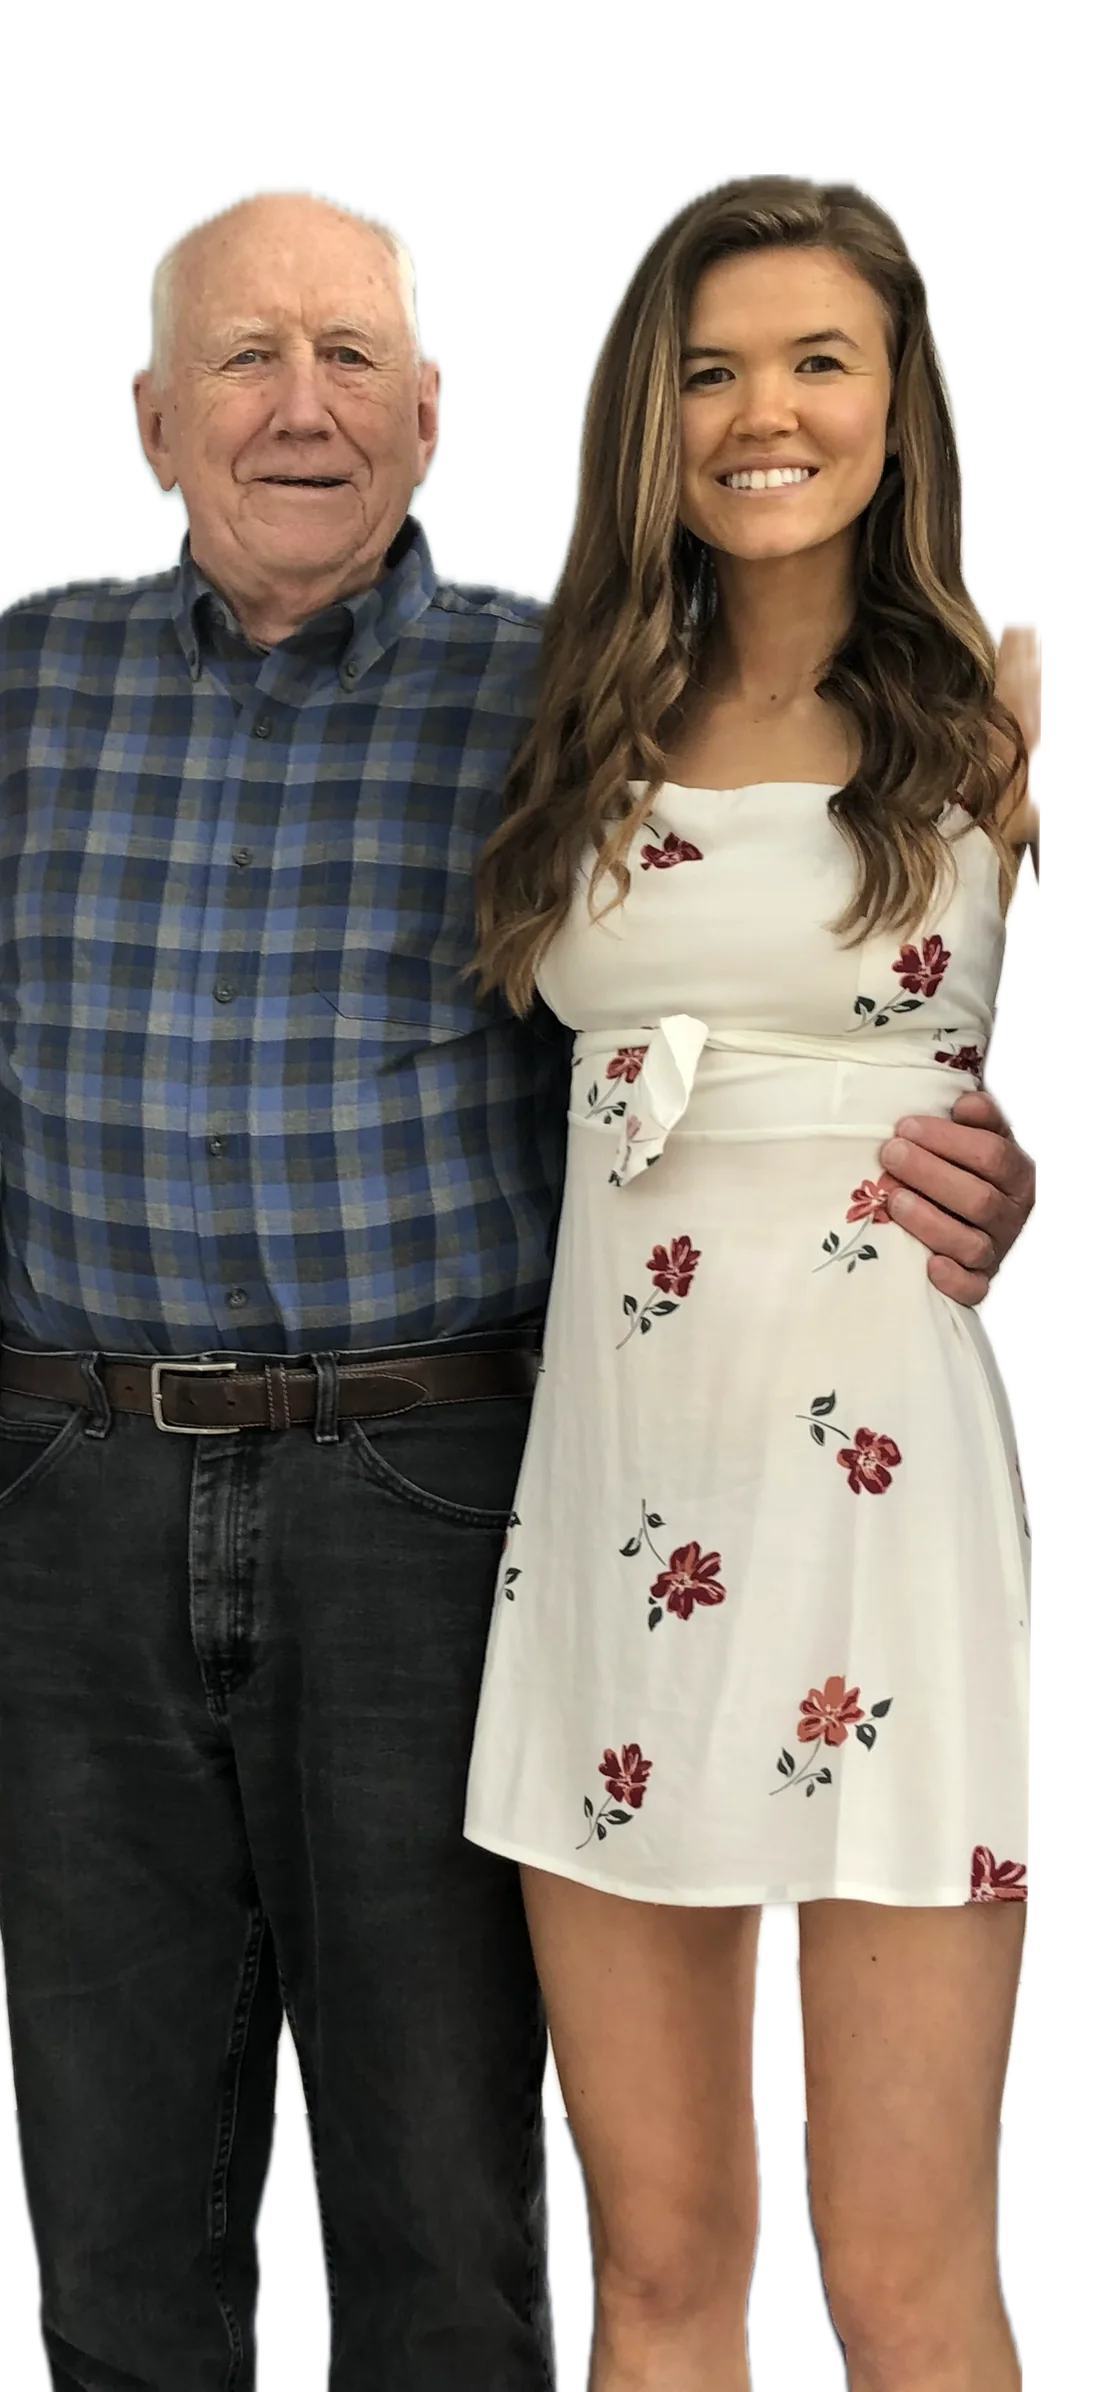
We’re a grandfather and granddaughter team. Bob, the grandfather, is a retired mechanical engineer. He first noticed that something was off with the way Social Security interacts with taxes, and spent several years at the kitchen table figuring out what was really going on. Megan, the granddaughter, is the one who looked at what he’d built and said “other people need to see this,” and helped turn his hand-drawn graphs into a tool anyone can use.
What follows is the story of how we got here, told in our own words. Bob tells the first part, which is really his story. Megan picks up when the project became something we were doing together. We’ve tried to write it the way we’d tell it to you over coffee, so you’ll know who you’re trusting when you use the tool.
Chapter one
It was 2016. My wife and I wanted to take a family vacation, and we needed $5,000 to make it happen. Like a lot of retirees, we had some money in an IRA, so we took a distribution to cover the cost. We took the trip. It was a good one.
Then April came, and with it the tax return. There was a number on it that made me pause. We owed an additional $2,043 in taxes.
That wasn’t what I was expecting. The additional tax was far more than I’d planned for on a withdrawal of that size, on money we had already earned, from an account we had already paid into. It didn’t compute.
So I called our accountant. He was a good one. Careful, patient, honest. I asked him to explain how a $5,000 vacation had turned into a $2,043 tax bill. He looked at the return with me for a while, and then said something I’ve never forgotten.
Once you start receiving Social Security Benefits, funny things happen to your taxes.
— Our family accountant, 2016
That was his explanation. He did his best to say more. He talked about thresholds and phase-ins and something called MAGI. But by the end of the conversation I understood two things. The first was that he knew something was going on. The second was that even he couldn’t explain it in a way I could use. That answer sparked a curiosity I couldn’t let go of.
Chapter two
I went home and sat down at the kitchen table with a pencil and a piece of graph paper. There’s a big window there, and good light in the afternoon. I had spent my career as a mechanical engineer solving problems this way. You take what you don’t understand, break it down, and draw it out until the pattern becomes clear.
I started with simple questions. What if the withdrawal had been $2,000 instead of $5,000? What about $10,000? What about nothing at all?
I didn’t have answers, so I set out to find them. I built tables of scenarios, varying one piece of income at a time, tracking what the tax looked like at the other end. I drew graphs. Most of the early ones were wrong, but I kept going.
Over time, something unmistakable emerged. For some ranges of income, the additional tax was zero. Not small. Zero. For other ranges, every additional dollar of income was taxed at a rate far higher than my tax bracket suggested, sometimes close to double. Then, past a certain point, the tax rate settled back down to normal.
There were three distinct regions. Three zones. And once I saw them, I couldn’t unsee them.
Chapter three
The three zones aren’t something I invented. They’re something I noticed. The tax code (written in 1983 and amended in 1993) produces this structure automatically. It’s there, in every scenario, for every Social Security recipient.
The first zone I called the No-Tax Zone. In this stretch, you owe little or no federal tax. The 1983 law included income thresholds below which Social Security benefits aren’t taxed, and those thresholds have never been adjusted for inflation. Today, the No-Tax Zone extends much further than it did when the law was written.
The second zone I called the High-Tax Zone. This is where many retirees find themselves without knowing it. In this zone, every additional dollar of income doesn’t just get taxed at your bracket rate. It also causes more of your Social Security to become taxable. So each new dollar of income adds $1.50 or $1.85 to your taxable income, not just $1. Your effective tax rate can be nearly double your bracket rate. This is where my $2,043 tax bill came from.
The third zone I called the Same-Old Zone. Once 85% of your Social Security has been pulled into taxable income, the compounding stops. From that point forward, additional income is taxed at your ordinary bracket rate, just as it would be for anyone else. The catch-up is finished.
Here’s what I want to emphasize, because it’s often misunderstood.
Not every retiree passes through all three zones. Where you are depends on two things: how much Social Security you receive, and how much other income you have. Someone with modest income might spend their entire retirement in the No-Tax Zone. Someone with substantial retirement account withdrawals might spend it entirely in the Same-Old Zone. The zones are the structure. Your particular situation determines which one you’re in, and what you can do about it.
Somewhere along the way, I got curious whether anyone else had figured this out. After a while, I found a paper published in 2014 in the National Tax Journal, by Leonard Burman of the Urban Institute, Norma Coe of the University of Washington, Kevin Pierce of the Internal Revenue Service, and Liu Tian of Syracuse University.[1]
Four professional economists, working with actual tax return data, had arrived at exactly the same numbers I had with graph paper at my kitchen table. The effective tax rates. The 46.25% ceiling. All of it, confirmed.
Relief, mostly. I hadn’t been wrong. But also bewilderment. If this was known, why had no one ever told me? The academic paper is precise and careful, but it isn’t something an ordinary retiree could pick up and use. My graph could be.
— Bob
[1] Burman, Leonard E., Norma B. Coe, Kevin Pierce, and Liu Tian. “The Effects of the Taxation of Social Security Benefits on Older Workers’ Income and Claiming Decisions.” National Tax Journal 67, no. 2 (June 2014): 459–85. https://doi.org/10.17310/ntj.2014.2.07.
Chapter four
For a long time, Grandpa’s project stayed in his kitchen. He refined the graph, built data tables, named the three zones, and gave the chart a name: The Guetschow Graph. He started thinking of the whole thing as a research project that happened to be happening at his house.
I remember the first time he showed it to me.
I was in my twenties, visiting home. He pulled out these hand-drawn graphs on big sheets of paper and started explaining the three zones. I had grown up watching Grandpa tinker with projects, so my first thought was that this was another one of those. I nodded along. I didn’t really understand it.
Then I sat with him at the kitchen table and worked through the numbers using my own hypothetical retirement scenario. And it clicked. When it clicked, I understood two things at the same time. The first was that what Grandpa had built was real, and rigorous, and genuinely useful. The second was that no one was going to find their way to it unless we made it easier to find. Research that stays in a kitchen doesn’t help anyone else.
I knew that second part from experience. I had spent years working in tech, including at a payroll software company, where I saw up close how little most people understood about their own retirement. Not because they weren’t smart, but because no one had ever explained it to them in a way that stuck. The gap between what people needed to know and what anyone was actually teaching them was wider than I would have guessed. That gap stayed with me, and it shifted how seriously I started thinking about personal finance in general. It was part of why Grandpa’s project caught my attention the way it did. I had already seen the problem from the other side.
So I said what Grandpa already knew but hadn’t quite admitted to himself: Grandpa, this needs to be a real thing. Other people need to see it.
Grandpa is a mechanical engineer. He knows how to draw a graph. He doesn’t know how to build a website or an interactive tool. I offered to help, and I brought along someone else who could help too: my partner, who was working toward his PhD in mechanical engineering. The symmetry wasn’t lost on either of us. Grandpa drew the graph by hand across years at the kitchen table. My partner helped us build and verify the tool that would carry it into the world. Two engineers, two generations, same instinct to figure things out until the math holds up.
Chapter five
What has followed has been the most unexpected part of this whole project for me.
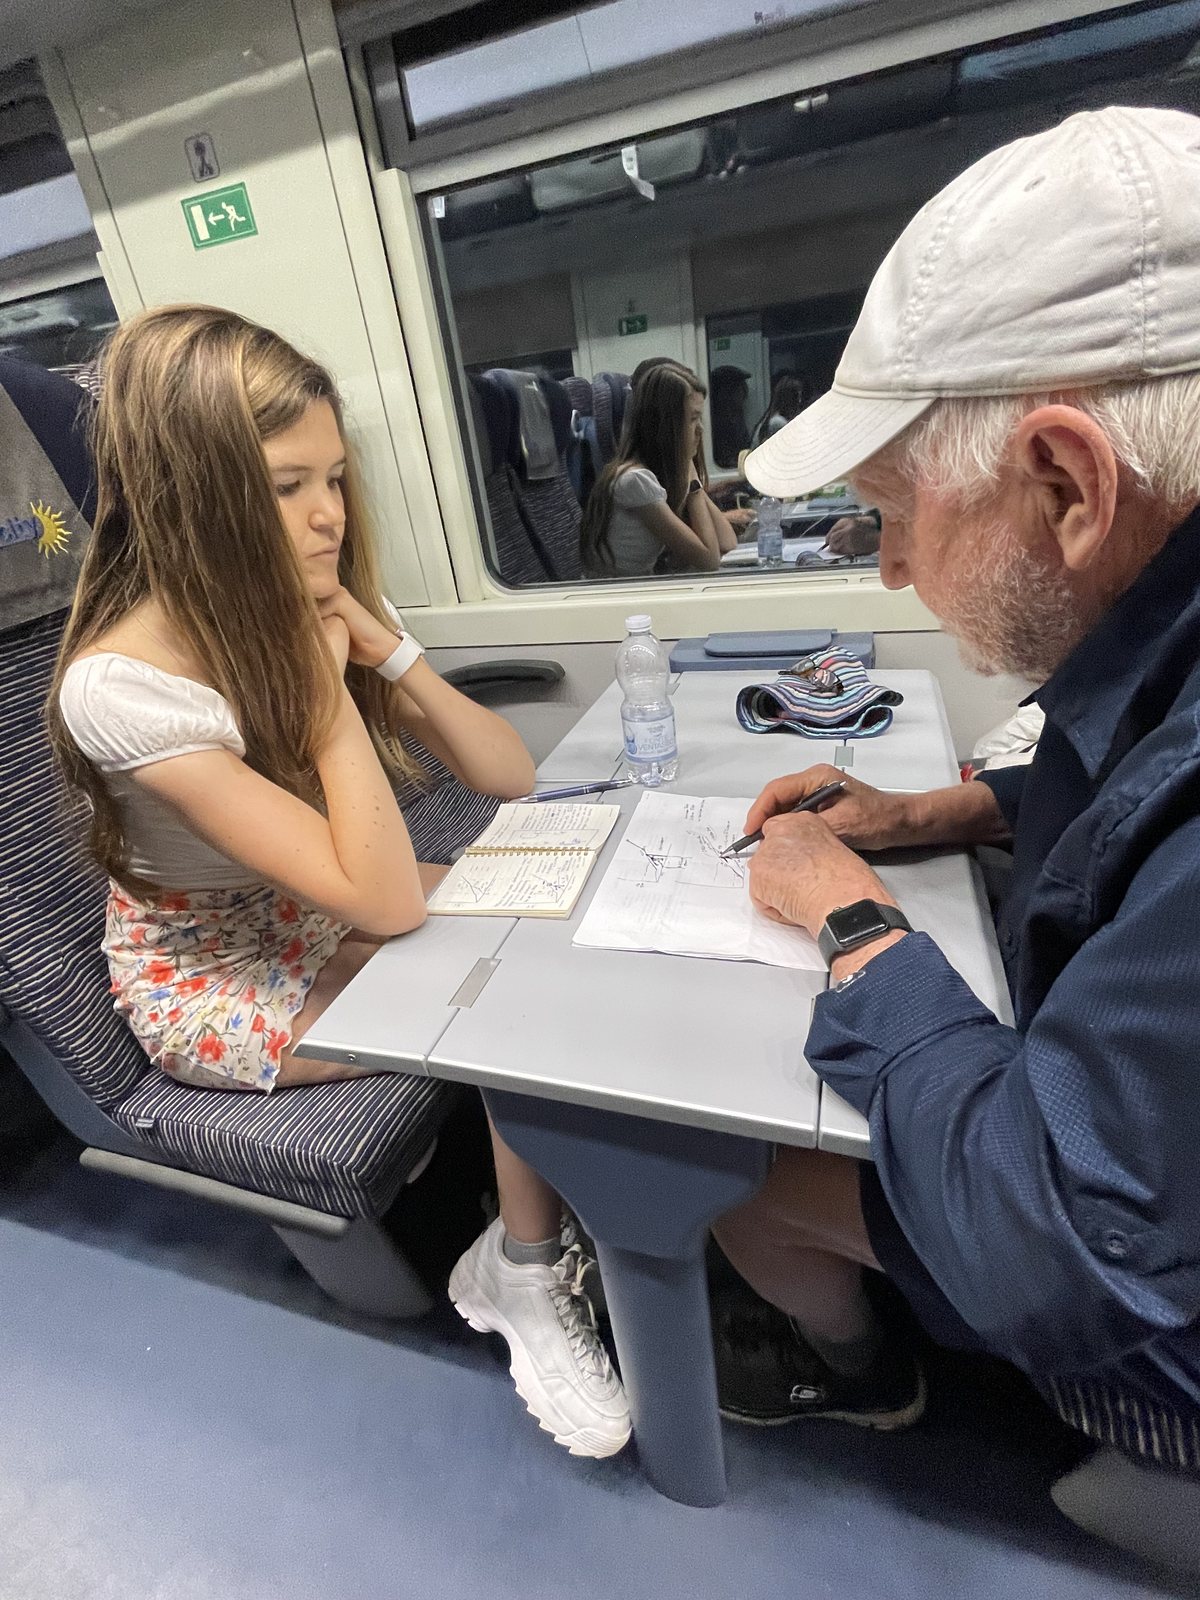
Grandpa and I have spent hours at the same kitchen table where he first sat down with the tax return in 2016. I bring my laptop. He brings his graphs. He explains the math, I ask the kinds of questions a smart outsider asks, and we both learn things we didn’t know before. My partner has worked alongside us too, double-checking the calculations so the tool holds up to the same standard Grandpa held his own work to.
Together, we’ve turned his hand-drawn graphs into something a retiree can use on their phone. We’ve built an educational website. We’re launching The Guetschow Graph through Halo Family Finance, so that no one has to figure this out from scratch the way Grandpa did.
What we’ve built so far is the educational side. Articles that explain each of the three zones. The graph itself, drawn and annotated for anyone to look at. And a calculator that takes two numbers (your Social Security benefit and your taxable income) and tells you which zone you’re in, what your effective tax rate is, and where the catch-up ends and your rate returns to normal. That much is done, and it’s free.
As people start using The Guetschow Graph, we’ll be listening to what they ask us next. There may be more we can build, but for now, the graph itself is what we have to offer. We think it’s enough to make a real difference.
Chapter six
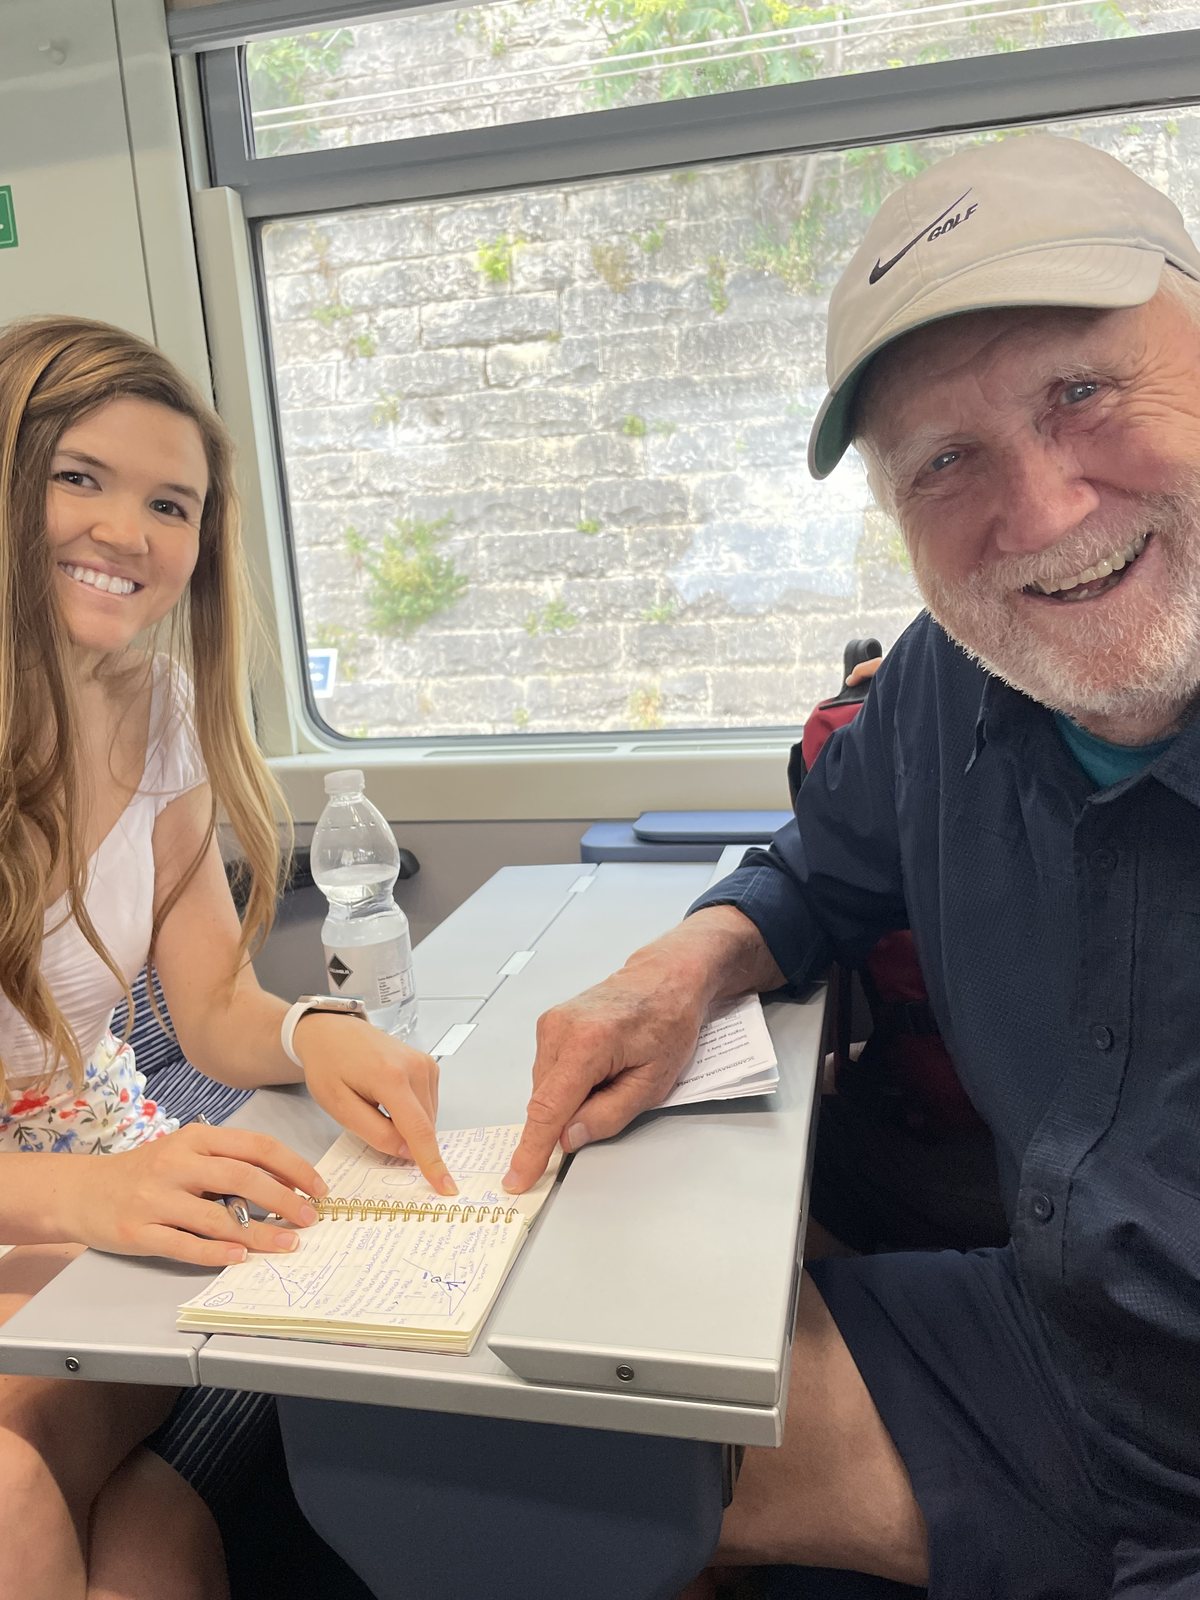
There’s one more thing we want to say, together.
Earlier this year, Grandpa was diagnosed with Alzheimer’s. That’s why we’re launching now, rather than waiting until everything is polished. His legacy, and the mission he set out to accomplish, is too important to delay. Grandpa wants retirees to make better financial decisions. He built this tool so they can. We’re sharing it so his work reaches the people it was built for.
Personal finance knowledge doesn’t pass down between generations very well. Each generation tends to figure it out from scratch, often too late. What we’re doing, at this kitchen table together, is one small effort to change that. Megan now understands retirement taxes better than most people twice her age. She’ll bring that understanding to her own retirement, decades from now. She’ll teach it to her children. That’s how knowledge is supposed to move: from one generation to the next, at kitchen tables, over coffee.
We also hope, over time, that this project becomes something that gives back. Someday, we’d like to find ways to support Alzheimer’s research with what we build, so other families don’t have to race the clock the way ours is.
Thank you for reading. Thank you for being here. The Guetschow Graph is live now, and we’re glad you found your way to it. 💜
— Bob & Megan Guetschow